The state of UK employee engagement in 2026.
Every spring brings a fresh crop of engagement statistics, and they rarely agree with each other. This is what the 2026 evidence actually says, why the headline numbers differ so much, how the sectors compare, and what the organisations that beat the average are doing.
On this page
Engagement is flat at a low level, stress and pay pressure are up, the line manager is the biggest lever, and the sectors differ in character more than in level.
Free download: UK employee engagement 2026 at a glance ↓Four large surveys describe the UK workforce in 2026, and on the face of it they disagree. Gallup says one in ten employees is engaged. The CIPD says seven in ten are satisfied with their job. The NHS Staff Survey scores engagement at 6.75 out of 10; the Civil Service People Survey puts it at 65%. All four are right. They are measuring different things with different instruments, and the first job of anyone reading engagement statistics is to know which is which.
Why the headline numbers disagree
- Gallup’s 10% is the number most often quoted and most often misused. It is derived from twelve items and counts only the highly involved and enthusiastic, so it is a measure of the highly committed, not of everyone who is broadly positive. On that measure the UK sits at 10%, against 12% for Europe and 20% for the world, and it has fallen seven points since 2012. It is a fair comparison between countries, and a poor one against any employer’s own survey.
- The CIPD’s 70% is a single question — how satisfied are you with your job — put to 5,074 UK workers between December 2025 and February 2026. Satisfaction is not engagement: you can be content and coasting. The same survey finds 18% likely to quit within twelve months, and a separate February poll by Ciphr puts the share who want to move jobs this year at 24%.
- The sector surveys use their own indices. The NHS Staff Survey’s engagement theme is a 0–10 composite across 766,285 respondents; the Civil Service index is a percentage across 343,961. Vendor benchmarks such as Hive’s (7.4 out of 10 in the first quarter of 2026, from more than 500,000 UK responses) average a different question set again.
Our rule, in our own reporting and in this piece: compare like with like where you can, say “directional” where you cannot, and never put a strict measure next to a broad one as if they were the same thing.
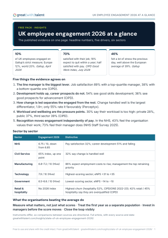
UK employee engagement 2026 at a glance
The headline numbers, the five drivers and the sector table on one printable page, with sources.
The national picture: flat, stressed, and underpaid in people’s own estimation
Set the instruments aside and the 2026 evidence tells one story. Engagement is flat at a low level and has been for several years. Stress is high and rising: 46% of UK employees told Gallup they had felt a lot of stress the previous day, five points up on the previous three-year rolling average and well above the European average of 39%. A quarter tell the CIPD that work harms their mental health, rising to 47% among people with too much to do. Daily loneliness, at 18%, also sits above the European average.
Pay is the sore point. Half of UK workers are satisfied with their pay, and the figure runs from 40% among those earning under £20,000 to 72% above £60,000. Only 51% can keep up with all their bills without difficulty, and a third say money worries have affected their work. Better pay and benefits is the top reason for changing jobs, cited by 29%; among people actively considering a move, 36% say they feel underpaid. Employers, meanwhile, expect to award a median 3%, as they have quarter after quarter, against inflation of 3.3% in March. The gap between what people feel they are worth and what the market is offering is not closing.
The labour market itself has cooled. The CIPD’s net employment balance stands at +10, with the public sector negative for a fifth consecutive quarter; a third of employers still report hard-to-fill vacancies. People are less able to leave than they were two years ago, which flatters retention figures and does nothing for engagement.
Five things the evidence agrees on
- 1. The line manager is the biggest single lever. The CIPD finds 59% of workers say their manager helps them perform well and 57% get useful feedback. The spread is what matters: people with a manager in the top quartile are 89% satisfied with their job; with a manager in the bottom quartile, 38%. Globally, Gallup reports that managers’ own engagement fell from 30% to 27% in 2024 (State of the Global Workplace, 2025) — the people with the most influence are the ones being squeezed.
- 2. Development holds up; career prospects do not. 54% say their job offers good skills development; only 36% see good prospects for advancement. Across 23 million global responses to Perceptyx (vendor data, 2023–2025), development sentiment peaks at onboarding (growth opportunities rated favourably by 85%) and falls through tenure to 51% at exit. In the NHS, the development sub-score has fallen to its lowest since 2021.
- 3. How change is led separates engaged workforces from the rest. The single largest differentiator between highly engaged employees and everyone else is whether change is handled effectively (1.9 times more likely among the highly engaged), followed by confidence in senior leadership. Globally, only 55% rate change management favourably. In the Civil Service, 32% say change is handled well.
- 4. Workload and wellbeing are the pressure points. 30% say their workload is too high — 28% in the private sector, 37% in the public sector, 39% in the third sector, and 35% among middle managers. In the NHS, 42% were made unwell by work-related stress in the past year and 31% often or always feel burnt out.
- 5. Recognition moves engagement independently of pay. Pay is the top reason for leaving, but recognition follows it in most datasets: 24% of Ciphr’s would-be movers cite feeling undervalued; in the NHS, only 43% feel the organisation values their work while 73% feel their immediate manager does. Organisations cannot always close the pay gap; they can nearly always close the recognition gap.
Sector by sector
The sectors differ more than the national averages suggest, and they differ in character, not just in level.
| Sector | Where engagement stands in 2026 | What is distinctive |
|---|---|---|
| NHS | 6.75 / 10, down from 6.85; 58% would recommend as a place to work (61% in 2024) | Pay satisfaction 32%; career development opportunities 51% and falling; stress-related illness 42%; line-manager scores at their highest since 2021 (manager values my work 73%) |
| Civil Service | 65% engagement index, up one point and the third-highest in 17 years | Benefits satisfaction 43%; only 32% say change is handled well; pay (39%) and progression (36%) the top reasons for wanting to leave |
| Manufacturing | 6.8–7.2 / 10 (Hive), eNPS +7 to +14 | 86% of manufacturers expect employment costs to rise; 48,000 vacancies and a technical-skills shortage; leadership and management the top retraining priority (66%); employer-reported turnover 10.9% (Make UK, 2024) |
| Technology | 7.9 / 10 (Hive), eNPS +31 to +35 — the highest-scoring sector | High response rates (76% across creative and technology) and strong advocacy; the benchmark the other sectors are measured against |
| Housing associations | 7.6–7.7 / 10 (Hive), eNPS +31 to +32 | Among the strongest in the not-for-profit space, with 80% response rates |
| Education | 6.6–7.0 / 10 (Hive), eNPS −5 to +5 | Low advocacy; the CIPD finds workload pressure highest in the public and third sectors, where most of education sits |
| Government | 6.5–6.6 / 10 (Hive), eNPS −14 to −10 — the lowest-scoring sector | Negative employment balance for five quarters; 26% of public-sector employers plan redundancies |
| Retail and hospitality | Not covered by the 2026 indices cited here; the highest churn of any sector (population-level turnover 52% in hospitality and 41.6% in wholesale and retail, CIPD/ONS 2022-23) | 42% of retail and 45% of hospitality workers say they are overqualified; 30% of hospitality workers are underemployed, wanting more hours than they get |
Two patterns run across the table. First, the public and voluntary sectors score far higher on meaning — 71% and 80% of their people say their work is useful to society, against 45% in the private sector — and far worse on workload, and the two cancel out in the engagement numbers. Second, where the evidence asks leaders what they want to invest in, the answer is management capability: two-thirds of manufacturers put leadership and management at the top of their retraining list, ahead of technical and digital skills, because it is the lever that does not need a bigger pay bill. In our experience the same holds in government and retail, where the pay lever is weakest.
What leavers say, sector by sector
Engagement surveys ask the people who stayed. Our exit questionnaire asks the people who went, in their final weeks, with every reason to be candid. The figures below come from 6,152 leavers at 30 UK organisations over the latest twelve months, with no organisation named and none included under fifty responses.
| Sector | Left with dissatisfaction a factor (median organisation) | Cited career progression | Cited reward and recognition | Movers who went to higher pay |
|---|---|---|---|---|
| Private sector | 52% | 49% | 45% | 77% |
| Public sector, education & not-for-profit | 51% | 41% | 37% | 59% |
| NHS trusts | 44% | 42% | 26% | 51% |
Career progression is in the top three reasons in every sector. Reward and recognition is cited by 45% of private-sector leavers against 26% in the NHS — the same pay-sensitivity gap the national surveys show from the other side. And in every sector the spread between organisations is wider than the gap between sectors: among private-sector organisations the share of leavers who went unhappy runs from 15% to 67%. Same labour market, same pressures, very different outcomes. In our experience most of that difference is local management, which means it can be moved.
Size matters, in both directions
Smaller organisations engage better and support worse. Hive’s index runs from 7.4 in organisations under 250 people to 6.7–6.9 above 5,000. But 38% of people in organisations under fifty have no channel for raising concerns, against 9% in organisations over 250, and 27% of people in organisations of 2–49 had no training in the past year against 13% in large employers. The small organisation wins on closeness and loses on structure; the large one the reverse. Response rates tell the same story: organisations of 1,001–5,000 people typically get 41% of their staff to answer a survey, against a commonly used target of 75%, and a survey that six in ten people ignore is a weak basis for any decision.
What the organisations that beat the average do
None of the 2026 evidence suggests a new answer. It suggests doing four known things properly.
Measure what matters, not just what scores
A low score on something nobody cares about is noise; a middling score on the thing people say matters most is the priority. Ask people which areas matter most to them alongside how they rate them, and act on the gap. Our six-driver model does this by design, and it changes the action list in almost every organisation we work with.
Treat the first year as a separate population
The tenure curve is the most consistent finding in the data: engagement is highest in the first months and falls fastest in the first year. A new-starter survey at three months and a conversation at six will catch most of it; an annual survey will not.
Invest in managers before the score moves, not after
Every dataset puts the line manager at the top of the list, and every dataset shows managers under more pressure than the people they manage. Protect the manager score you have; it is the cheapest engagement you will ever buy.
Close the loop visibly
The reason survey fatigue exists is that people answer and nothing happens. Share the headline numbers with every team, pick one change per team, do it, and say it came from the survey. The following year’s response rate is the measure of whether you did.
If you want to know where your organisation sits against these figures — and, more usefully, against the twenty years of like-for-like data behind our own benchmark — WinningFormula measures all six drivers, tells you which matter most to your people, and reports down to team level in plain English. Book a demo and we will show you what your numbers would look like.
Drawn from: Gallup, State of the Global Workplace 2026 (UK country data, April 2026); CIPD Good Work Index 2026 (July 2026) and Labour Market Outlook Spring 2026 (May 2026); NHS Staff Survey 2025 national results (March 2026); Civil Service People Survey 2025 (February 2026); Hive HR UK Employee Engagement Benchmarks Q1 2026; Ciphr, A snapshot of UK employees in 2026 (February 2026); Perceptyx, What 23 million employees say about engagement in 2026; Make UK/PwC Executive Survey 2026 (January 2026); CIPD/ONS and Make UK turnover figures as compiled by NatWest Mentor (2026); and the great{with}talent leaver benchmark, computed from LastOpinion exit questionnaires at 30 UK organisations. Hive, Ciphr and Perceptyx figures are vendor data and are described as such. Instruments differ; comparisons between them are directional. See also Why people leave: a year of UK exit data and the unhappy-leaver benchmark check.
The clearest thirty minutes in your week.
Send us your last engagement survey and we’ll show you what it’s missing – no charge, no deck, no obligation. Or start with a pilot or a 30-minute conversation.